

This Free Flow-Metrics Tool Was Too Technical For Me a Year Ago. Not Anymore.
An agent set up what I could not

Open-source flow metrics with JiraMetrics, no per-seat licence
Why native Jira reporting and paid plugins leave a gap
How I stood it up by pointing an agent at the repo and answering a few questions
The data-quality audit that matters more than any forecast

About a year ago I sat down to install JiraMetrics, decided it was above my pay grade, and closed the tab.
I want to be clear that this was not the tool’s fault. I am a producer, not a Ruby developer. What I saw was a gem, a Gemfile, a config file written in a language I did not speak, and a set of instructions that assumed I already knew how to make all of that talk to each other. I have thirty years of shipping games behind me and none of them involved bundler. So I filed it under “one day,” which is the folder where good intentions go to die.
If this is useful, there's more where it came from. Multiple free posts a week on game production, applied AI, leadership and how the sausage actually gets made.
The reason I came back is a small pile-up of coincidences. We are in the middle of a Jira hygiene project right now. We are a fast-moving startup, and like a lot of fast-moving startups we did not treat flow as a priority when we were young. You get away with that for a while. Then the board fills up with years of drift and half-kept conventions, and you start paying what I think of as the maturity tax: the bill for all the discipline you skipped, handed to you later with interest. The cleanup is us paying it down.
Only this morning I was walking a new producer on the team through that work, giving them the why behind it, proselytising about flow the way I tend to. Then Mike Bowler, who builds JiraMetrics, posted an update about the tool on LinkedIn. My folder of good intentions got a revisit. And this time, because I have spent since January building agentic workflows for real, the setup that beat me a year ago was no longer the obstacle it had been.
My Ruby knowledge is still zero, for the record. What changed is the agent sitting beside me, and the way it has quietly dissolved the entire category of “setup friction that stops a non-developer cold.” I pointed Claude Code at the repository and the docs, and in an afternoon I had a working report against one of our real production boards. Not a toy board. A live one with years of history and all the accumulated scar tissue that implies.
I am going to walk through what it took, because the walkthrough is the point. But first I need to explain why I care about this at all, and why I have spent years being cagey about recommending it to anyone.
Why I keep dragging people back to flow metrics
Flow metrics are the small set of numbers that describe how work actually moves through your system. How long an item takes from start to done, which is cycle time. How many items you finish in a period, which is throughput. How much work is open at once, which is work in progress. How old the in-progress items are getting, which is ageing. That is most of it. They are boring in the way that a thermometer is boring, and just as hard to argue with.
I like them because they are honest. Velocity in story points can be gamed by a team that has learned what the burndown wants to see. Cycle time cannot, because it is measured in days on a calendar and the calendar does not care about your estimates. When someone asks me “will this be done by the end of the quarter,” I would rather answer with a distribution than a gut feel. The ActionableAgile approach that a lot of Kanban practitioners use puts it plainly: take your historical cycle times, look at the 85th percentile, and you have a defensible service level expectation. Fifteen per cent of past items took longer than that number. That is a forecast a stakeholder can hold you to and one you can actually meet.
The wider industry keeps rediscovering this. The 2025 State of DevOps research found that AI adoption is lifting throughput while quietly raising instability, more rework, longer cycle times to recover. You only see that trade if you are measuring flow in the first place. Teams that are not measuring it are flying the plane by feel and calling the turbulence normal.
So flow metrics are the thing I believe in. Here is the part I have always been quiet about.
The gap, and why I stayed out of it
The good tooling for this has always cost money, and I have never enjoyed recommending it.
If you want proper flow analytics on top of Jira, you have had two roads. The first is a third-party SaaS platform that sits alongside Jira, ingests your data, and gives you the charts. The second is a Jira Marketplace plugin that runs inside Jira itself, so the analytics live where your team already works. Both are legitimate. Both are also priced per user per month, and the Marketplace apps in particular scale their bill with the size of your team, which means the tool gets more expensive precisely as it gets more useful.
Native Jira gives you charts. What it does not give you is the truth about whether those charts can be trusted.
The alternative most teams settle for is Jira’s built-in reporting, and it is thin. You can filter by sprint and assignee, but you cannot restructure a report, add a metric, or build a proper cross-project view. The documented limitations are well known to anyone who has tried to answer a real question with a native gadget and given up. So a producer like me ends up stuck between a paid tool I have to justify to finance and a free one that will not tell me what I need to know. For years my honest position has been that flow metrics are worth it, followed by a quiet cough when someone asks how much the software costs.
JiraMetrics changes that calculation, because it is free, open source, and self-hosted, and you own every part of it.
What JiraMetrics actually is
JiraMetrics is an open-source tool by Mike Bowler, released under Apache 2.0, that pulls your issue history straight out of Jira and renders it into a flow-metrics report. Cycle time distributions with percentile breakdowns. Throughput over time, broken out by issue type. Cumulative flow diagrams. Ageing charts for work in progress. Monte Carlo forecasting for the “when will it be done” questions. It is distributed as a Ruby gem, it needs a recent Ruby, and the source lives on GitHub where you can read every line that touches your data.
That last point matters more than it sounds. When the tool runs on your machine against your API token, there is no third party ingesting your board. No data egress, no seat count, no renewal conversation.
Thirty-plus years of production work went into this. Most of it didn’t make the post. New posts every week. Free to read, free to subscribe.
What it took to stand it up
Here is the honest version. I pointed Claude at the repository and told it what I wanted.
That sentence is doing a lot of work, so let me be fair about why it was easy for me. I already run a mature agentic project that can talk to my Jira. The connection, the credentials, the permission to read a board, all of that plumbing already existed because I built it up over months for other reasons. So JiraMetrics was not landing on bare ground. It was landing next to an agent that already knew how to reach my instance.
Given that, the setup was a conversation. Claude handled the Ruby it needed, wired up the config that describes which board to report on and how much history to pull, and sorted the credentials and the diagram tooling without me hand-editing any of it. My job was to answer a few questions. Which board. How far back. Where the report should land. Then it did the magic and handed me a report.
I want to be careful not to oversell that, because the reason it went so smoothly is the groundwork I had already laid. A year ago none of that groundwork existed, and the same tool beat me. So the real story is not that the tool got simpler. It is that I had quietly built the thing that makes tools like this simple, and I did not clock how much leverage that gave me until I watched it stand up a Ruby project I could not read.
One of my next experiments is to set this up from a clean new install with a different harness, no existing plumbing to lean on, and see how much of that friction comes back. I will keep you posted.
The part I did not expect
I came for the cycle time charts. I stayed for something in the report I did not know I needed.
JiraMetrics ships a data-quality diagnostics section. Before it trusts your board’s history to draw a single chart, it interrogates that history and tells you where it does not add up. Status transitions that do not map to any visible board column. Issues that moved backwards across workflow categories. Tickets that were created directly into an in-progress column instead of a proper starting status, which quietly corrupts every cycle time calculation downstream. Parent and child issues whose completion states disagree with each other.
The most valuable output of a flow-metrics tool turned out to be the part that tells you your flow metrics cannot yet be trusted.
This reframes the whole tool. It is not only a chart generator. It is an auditor for whether your board’s data can be believed at all. And that is exactly where it pulled ahead of the tools I already knew.
Clean data before predictability is not a lesson I needed taught. I have known for years that a forecast built on a dirty board is theatre. We already knew this board needed work, and we were already using agentic tools to hunt the obvious outliers. What I lacked was a tool that did more than point at the temperature.
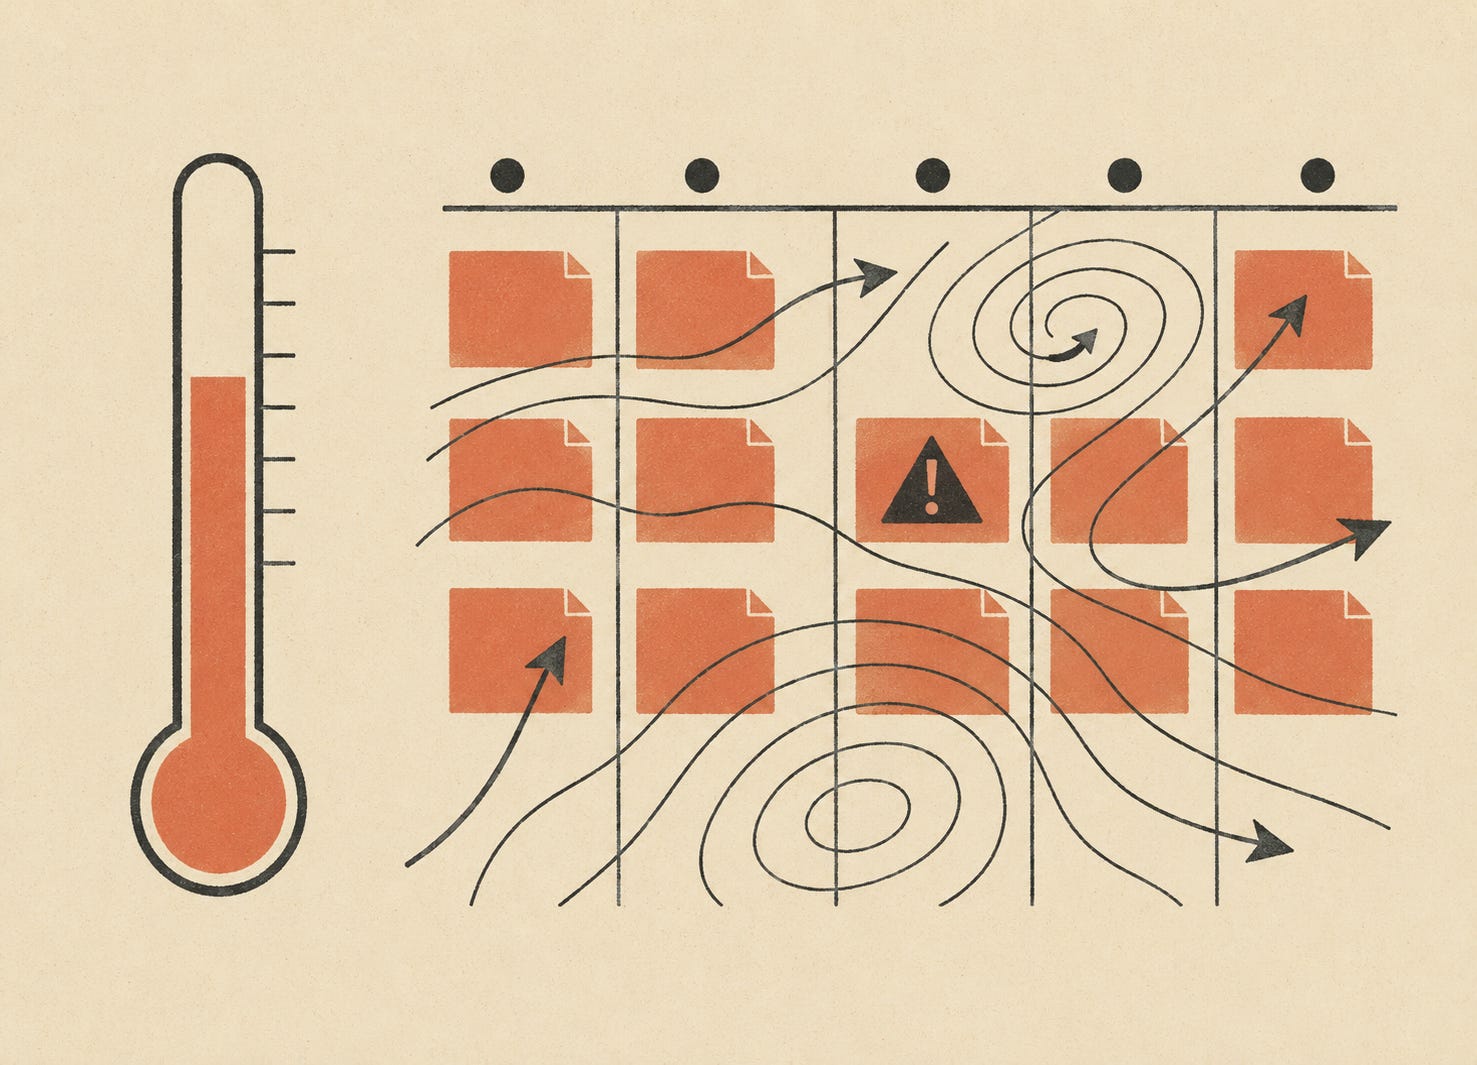
I have spent real time in tools like Actionable Agile, and they are good. Actionable Agile is a good thermometer. It gives you an accurate number and leaves you to work out what it means. JiraMetrics is closer to a meteorologist. It reads the same data and tells you what the reading implies: which items are ageing badly, where flow is stalling, and which of your numbers you should not trust yet because the history underneath them is broken. Diagnosis is table stakes. The interpretation is the part I had been missing.
So the order was never in question for me. Get the flow data under control, then chase predictability. What is new is a free tool that helps with both halves and does the first half on the first run. The Monte Carlo forecasting is real and I will get to it. But the first job is the audit, and the audit was immediate and specific.
What the first run gave us
I am not going to walk through our numbers. What I will say is that the diagnostics turned up clear, specific problems on a real years-old board, the kind of findings you cannot argue with because they point at individual tickets and named workflow gaps. We were already cleaning up the board, running on instinct and a general sense that it had rotted. The report did not start that effort. It aimed it. It turned a vague hygiene project into a targeted list, and it did so off the first run, not the tenth after months of tuning. The first one.
It also did something I had not expected on the people side. That new producer I was proselytising this morning has spent days on cleanup with only my word that it matters. The report handed him the why in a form he could see. The maturity tax is easier to pay down when the invoice is itemised.
Where this goes next
There is a forward-looking piece worth naming. JiraMetrics does not stop at a static report. It ships an MCP server, which means the same flow analysis is exposed as tools an AI agent can call directly. Once it is wired up, you can ask an agent things like which work is ageing past sixty days, or what has been sitting in review the longest, and it queries your flow data in context instead of you copying charts into a chat.
I am going to get there. But the order matters, and the tool taught me the order. Get the flow data under control first, then let the machines reason about it. My plan is to bring JiraMetrics into regular production as an automated weekly report, so the audit runs continuously and the board stays honest instead of drifting back into the state I just found it in. The Monte Carlo simulation, the probabilistic forecasts, the agent asking clever questions of clean data, all of that comes later, once the board can be trusted.
The thing I want other producers to take from this is smaller than it sounds. Rigorous flow metrics used to sit behind two gates: a licence you had to justify, and a setup you had to be a developer to clear. The licence gate is gone, because this is free and yours. And the setup gate, the one that stopped me cold twelve months ago, is the part that quietly got easy.
If this changed how you think about even one thing, the next post might too.